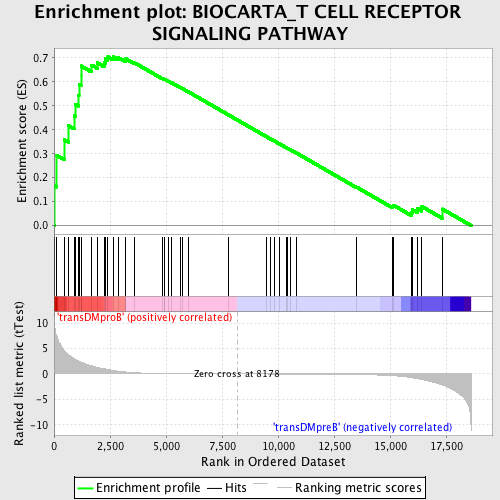
Profile of the Running ES Score & Positions of GeneSet Members on the Rank Ordered List
| Dataset | Set_04_transDMproB_versus_transDMpreB.phenotype_transDMproB_versus_transDMpreB.cls #transDMproB_versus_transDMpreB.phenotype_transDMproB_versus_transDMpreB.cls #transDMproB_versus_transDMpreB_repos |
| Phenotype | phenotype_transDMproB_versus_transDMpreB.cls#transDMproB_versus_transDMpreB_repos |
| Upregulated in class | transDMproB |
| GeneSet | BIOCARTA_T CELL RECEPTOR SIGNALING PATHWAY |
| Enrichment Score (ES) | 0.7044501 |
| Normalized Enrichment Score (NES) | 1.5342708 |
| Nominal p-value | 0.0113852 |
| FDR q-value | 0.44374236 |
| FWER p-Value | 0.954 |
| PROBE | DESCRIPTION (from dataset) | GENE SYMBOL | GENE_TITLE | RANK IN GENE LIST | RANK METRIC SCORE | RUNNING ES | CORE ENRICHMENT | |
|---|---|---|---|---|---|---|---|---|
| 1 | LCK | 15746 | 27 | 9.283 | 0.1662 | Yes | ||
| 2 | LAT | 17643 | 124 | 7.317 | 0.2932 | Yes | ||
| 3 | VAV1 | 23173 | 461 | 4.594 | 0.3581 | Yes | ||
| 4 | RALBP1 | 9725 | 638 | 3.809 | 0.4174 | Yes | ||
| 5 | PPP3CC | 21763 | 894 | 3.021 | 0.4582 | Yes | ||
| 6 | ARFGAP3 | 22183 | 955 | 2.852 | 0.5065 | Yes | ||
| 7 | PTPN7 | 11500 | 1095 | 2.511 | 0.5444 | Yes | ||
| 8 | PPP3CB | 5285 | 1113 | 2.475 | 0.5882 | Yes | ||
| 9 | JUN | 15832 | 1203 | 2.302 | 0.6250 | Yes | ||
| 10 | ARHGAP4 | 9343 | 1204 | 2.301 | 0.6665 | Yes | ||
| 11 | CAMK2B | 20536 | 1673 | 1.604 | 0.6703 | Yes | ||
| 12 | RAC1 | 16302 | 1922 | 1.265 | 0.6798 | Yes | ||
| 13 | NFATC1 | 23398 1999 5167 9455 1985 1957 | 2241 | 0.988 | 0.6805 | Yes | ||
| 14 | RELA | 23783 | 2280 | 0.956 | 0.6957 | Yes | ||
| 15 | MAP3K1 | 21348 | 2404 | 0.849 | 0.7045 | Yes | ||
| 16 | GRB2 | 20149 | 2633 | 0.675 | 0.7044 | No | ||
| 17 | ARHGAP1 | 6001 10448 | 2873 | 0.518 | 0.7009 | No | ||
| 18 | FOS | 21202 | 3200 | 0.360 | 0.6898 | No | ||
| 19 | FYN | 3375 3395 20052 | 3206 | 0.359 | 0.6960 | No | ||
| 20 | CD3D | 19473 | 3602 | 0.234 | 0.6790 | No | ||
| 21 | MAPK3 | 6458 11170 | 4819 | 0.071 | 0.6148 | No | ||
| 22 | PRKCA | 20174 | 4927 | 0.066 | 0.6103 | No | ||
| 23 | SHC1 | 9813 9812 5430 | 4928 | 0.066 | 0.6114 | No | ||
| 24 | PIK3R1 | 3170 | 5108 | 0.059 | 0.6029 | No | ||
| 25 | ARHGAP6 | 24207 | 5261 | 0.055 | 0.5957 | No | ||
| 26 | SOS1 | 5476 | 5642 | 0.043 | 0.5760 | No | ||
| 27 | PIK3CA | 9562 | 5729 | 0.040 | 0.5721 | No | ||
| 28 | CD3G | 19139 | 6008 | 0.034 | 0.5577 | No | ||
| 29 | CD3E | 8714 | 7771 | 0.006 | 0.4630 | No | ||
| 30 | MAP2K4 | 20405 | 9480 | -0.016 | 0.3713 | No | ||
| 31 | CD4 | 16999 | 9643 | -0.018 | 0.3629 | No | ||
| 32 | PTPRC | 5327 9662 | 9820 | -0.021 | 0.3538 | No | ||
| 33 | PPP3CA | 1863 5284 | 10076 | -0.024 | 0.3405 | No | ||
| 34 | TRB@ | 1157 | 10351 | -0.028 | 0.3263 | No | ||
| 35 | ARHGAP5 | 4412 8625 | 10426 | -0.029 | 0.3228 | No | ||
| 36 | CD247 | 4498 8715 | 10539 | -0.031 | 0.3173 | No | ||
| 37 | PLCG1 | 14753 | 10828 | -0.036 | 0.3025 | No | ||
| 38 | ZAP70 | 14271 4042 | 13513 | -0.123 | 0.1602 | No | ||
| 39 | RAF1 | 17035 | 15103 | -0.349 | 0.0809 | No | ||
| 40 | NCF2 | 14098 5151 9446 | 15142 | -0.361 | 0.0854 | No | ||
| 41 | MAPK8 | 6459 | 15940 | -0.722 | 0.0555 | No | ||
| 42 | MAP2K1 | 19082 | 15996 | -0.765 | 0.0664 | No | ||
| 43 | HRAS | 4868 | 16218 | -0.935 | 0.0714 | No | ||
| 44 | ARFGAP1 | 14705 2854 | 16416 | -1.052 | 0.0798 | No | ||
| 45 | NFKBIA | 21065 | 17327 | -2.139 | 0.0694 | No |

